Network Pentest
A network pentest walks a target through Cybrium's reconnaissance, scanning, and gaining access phases. It discovers live assets, fingerprints services, and flags vulnerabilities that are reachable over the wire.
What it discovers
- Live hosts, subdomains, and related infrastructure picked up during reconnaissance.
- Open ports and services with protocol and version fingerprinting.
- Known CVEs and exposures tied to each service, enriched with EPSS and exploitability hints.
- Weak credentials or misconfigured services surfaced during the optional gaining-access phase.
When to use it
Use a network pentest before opening a new environment to the internet, after every significant infrastructure change, or on a recurring schedule for any asset that faces the public internet.
Any scan against a target you do not own requires a signed consent form and a live target-ownership check before the scan leaves the queue.
Launch from the chat bar
- Open a workspace and type a natural-language request such as
pentest 10.0.4.0/24orscan example.com. - Cybrium classifies the intent as a network pentest and prompts for authorisation if the target is new.
- Confirm the authorisation dialog. The scan enters the queue and the phase tracker switches to the Reconnaissance phase.
Launch from the dedicated UI
- Go to Scans -> New Scan -> Network.
- Enter one or more targets (host, CIDR, or domain), pick a scan profile (Quick, Standard, Deep), and choose whether to allow the gaining-access phase.
- Click Start scan.
What findings look like
Each finding shows the affected asset, service, CVSS severity, a plain-language description, and a remediation block. Findings tagged exploitable include a replay payload and chain context so you can see why the finding matters in your environment.
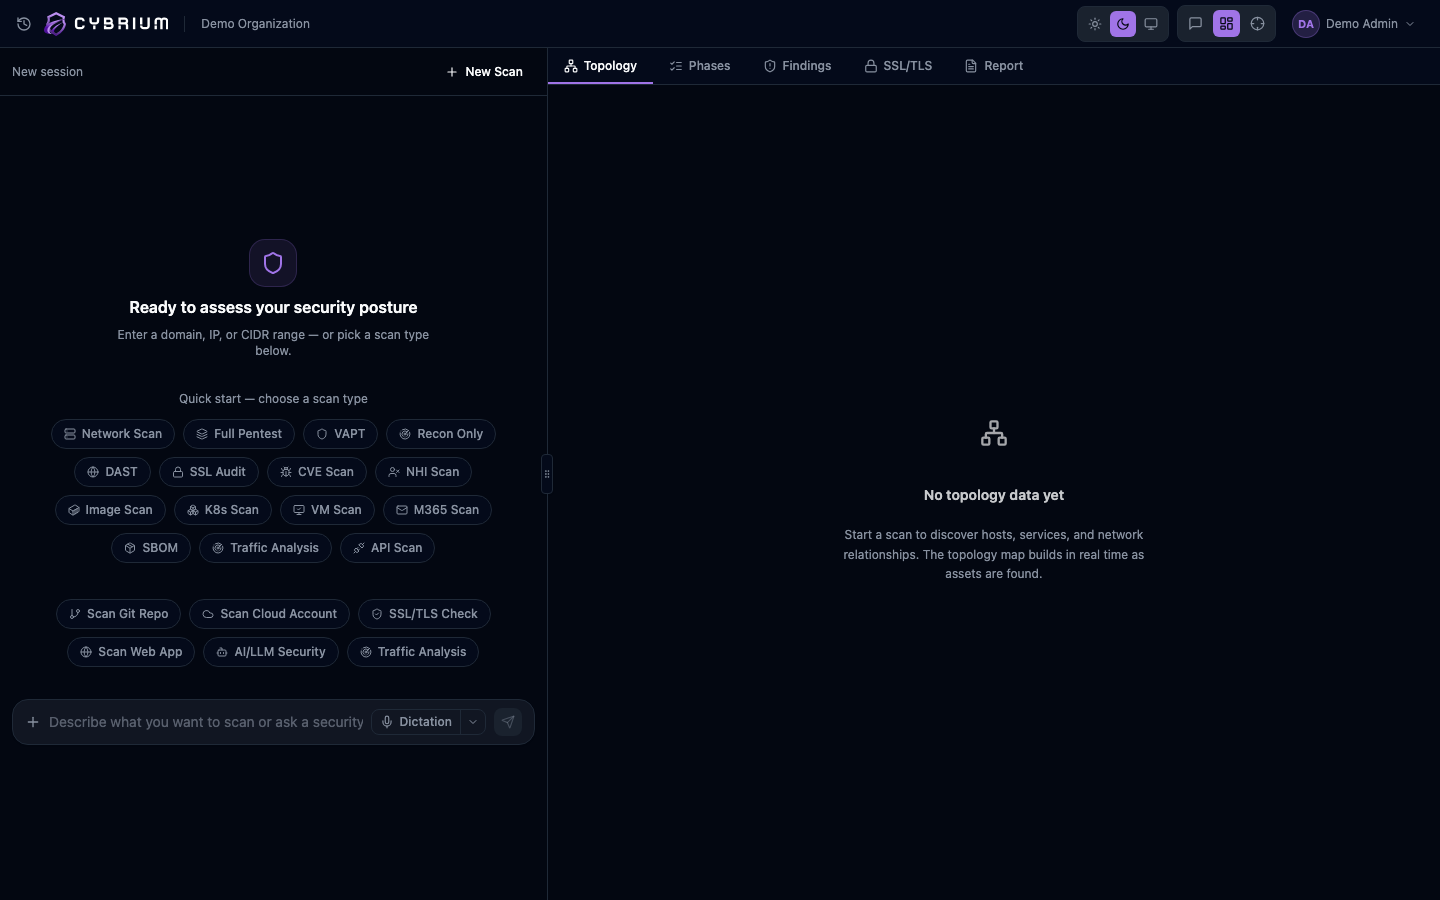
Where results appear
- Live in the Topology tab as nodes and edges are discovered.
- In the Findings tab, grouped by asset and severity.
- In the Report tab once the scan completes, with an executive summary and a technical appendix.