Your first scan
Cybrium's chat bar is the primary way to launch a scan. You describe what you want in natural language, an AI planner classifies intent, an authorisation step confirms you're entitled to test the target, and the scan executes across a live phase pipeline.
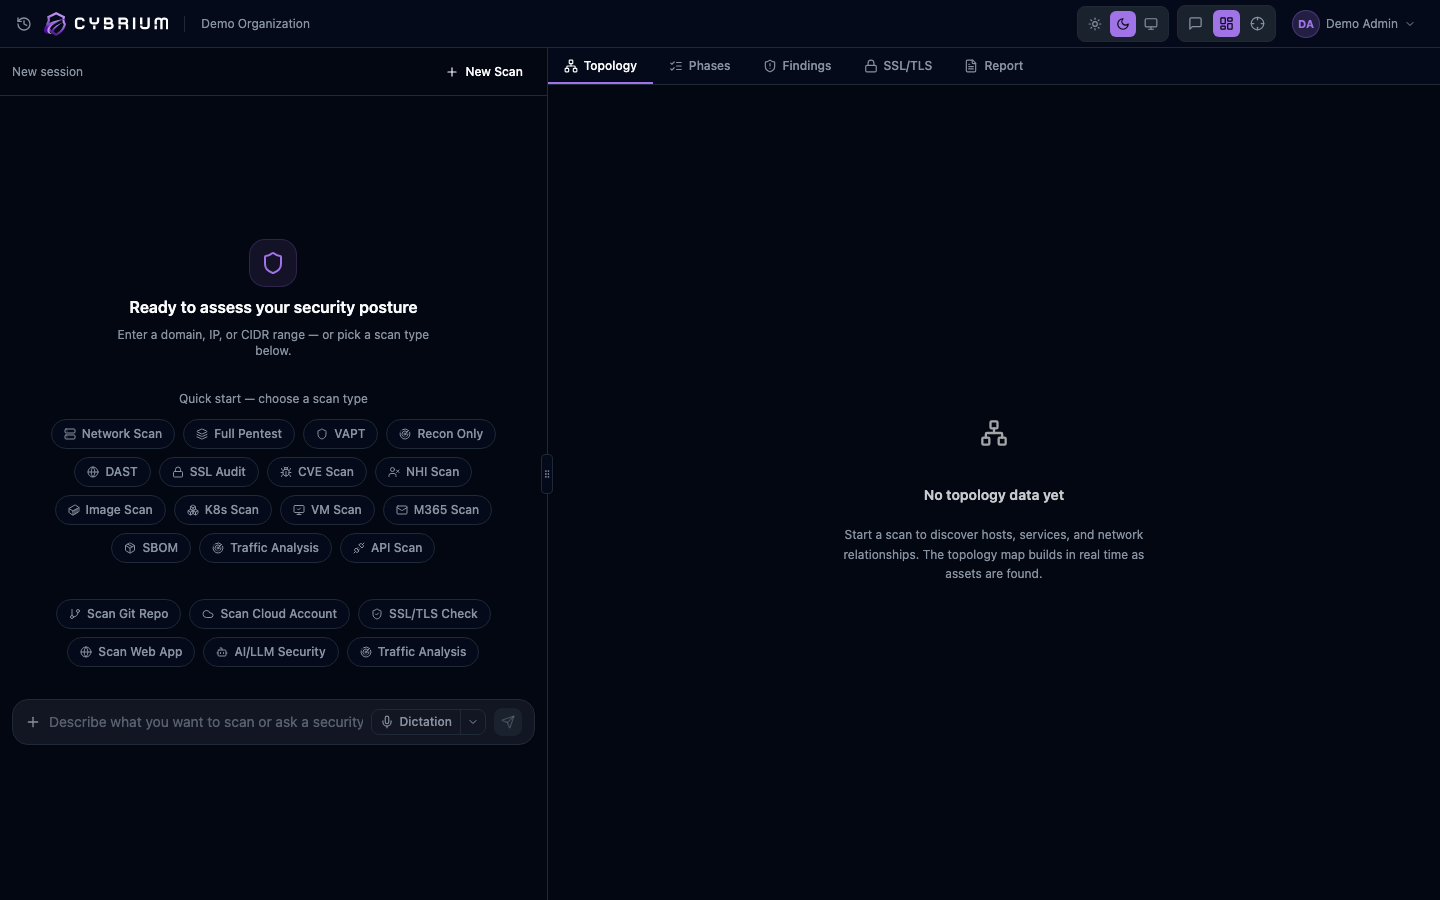
1. Describe the target
Type a target into the chat bar — a full URL, a hostname, an IP, or a range. Natural-language phrasing works too, for example "scan example.com for TLS issues" or "run a full pentest on 10.0.12.44". The AI classifies your request and picks the right scan family: web app, network, SSL/TLS, cloud, code repository, and more.
2. Confirm authorisation
Every scan that touches a live asset requires an explicit consent step. You must confirm in writing that you own the target or hold written permission from the owner.
Cybrium opens a consent document inline. Read the acceptable-use text, tick the attestation box, and — for higher-risk or destructive scans — complete a liveness capture: a short on-device camera check that records an auditable attestation tied to your session.

Your authorisation is logged against the scan record for audit purposes and ticketing integrations.
3. Watch the scan run
Once you confirm, the scan moves through a five-phase pipeline:
- Reconnaissance — asset discovery, passive enumeration, geolocation.
- Scanning — port and service discovery, vulnerability assessment, TLS analysis, web checks.
- Gaining Access — safe exploitation checks against discovered weaknesses.
- Maintaining Access — persistence and pivot detection (Pro/Enterprise only).
- Covering Tracks — evidence collection, timeline, and report generation.
Each phase streams updates over a WebSocket — new topology nodes, tool progress, and individual findings appear in real time.
4. Review findings
Findings arrive as they're confirmed, each tagged with severity, CVSS score, OWASP/CWE mappings, affected asset, and recommended remediation. In Dashboard mode the Findings tab filters and groups them; in Focus mode each finding renders as an inline card in the chat.
When the scan completes, the Report tab becomes available and a PDF is queued for delivery.